

SFS2X Docs / AdvancedTopics / troubleshooting-live-server
» Troubleshooting a live server
This guide provides an overlook of the main strategies to discover and report runtime server performance issues. We will describe a number of common issues such as lack of hardware resources, threading issue and memory leaks and discuss strategies to identify the underlying causes.
- Installing and using VisualVM
- Detecting memory issues
- Analyzing CPU performance
- Network performance
- Compiling and sending a support request
This document requires basic knowledge of the inner workings of a Java Virtual Machine (JVM), including memory management, class loading, threading and garbage collection.
» Installing and using VisualVM
For all of our troubleshooting examples we will work with a free tool called VisualVM provided by Oracle in every recent JDK (Java Development Kit), which is also available as a separate download from this website.
If you already have installed a JDK (version 6 or higher) you will find the tool under the bin/ folder. The executable is called jvisualvm.
The tool runs on every major operating system. If you don't have it installed on your machine it's a good time to download and install it.
» Working with a remote server
VisualVM can plug into any running local JVM with one click of the mouse but in case of a remote server we need to configure the remote JVM to be able to communicate with the tool over the network.
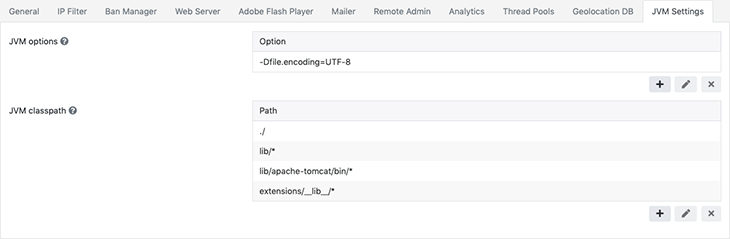
To do this we will open the SmartFoxServer's AdminTool, select the Server Configurator module, click on the JVM Settings tab and add the following parameters in the JVM Options section:
-Dcom.sun.management.jmxremote
-Dcom.sun.management.jmxremote.port=5000
-Dcom.sun.management.jmxremote.rmi.port=5000
-Dcom.sun.management.jmxremote.rmi.port=5000
-Djava.rmi.server.hostname=[external-ip-address]
-Dcom.sun.management.jmxremote.authenticate=false
-Dcom.sun.management.jmxremote.ssl=false
The jmxremote.port parameter can be any valid TCP port that works well with your server and is not blocked by firewall rules.
After this step is complete, we can restart SFS and we're ready to connect via VisualVM. Launch the application, and click on the Add JMX Connection icon to start a remote connection:
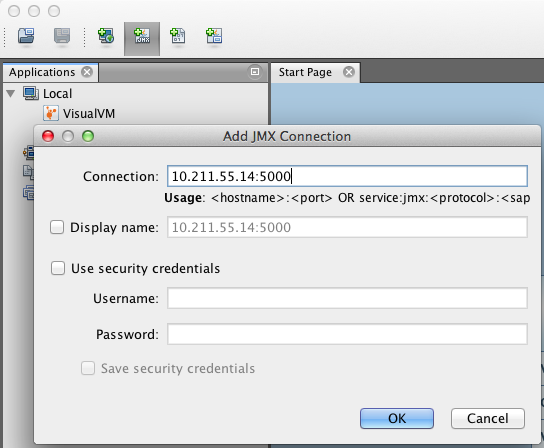
Type the remote IP address (or domain name) of the server and the port name in the form of <hostname>:<port> and click OK. Then double-click the new icon that appears on the left side-bar.
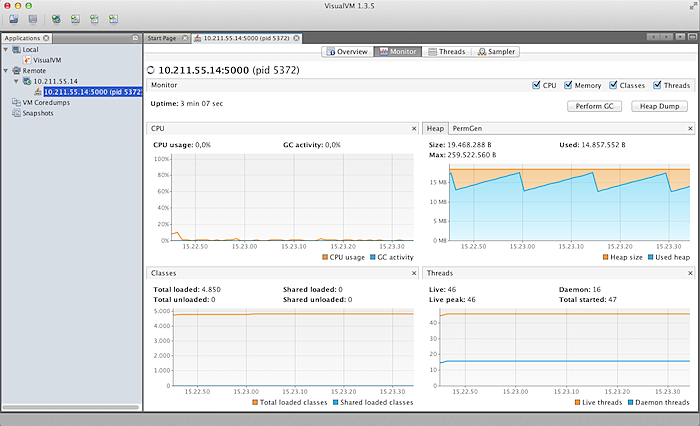
This is how the Monitor tab looks like when connected to the remote server.
» Detecting memory issues
Problems with low memory in Java typically cause CPU spikes because the garbage collection (GC) process must work harder. There are two main classes of issues related to memory management:
- Not enough memory to keep up with the application needs
- Memory leaks
In the former case we'll usually find a persistent activity of the GC which will affect the overall application performance even without a JVM crash.
The latter instead will consistently consume memory resources until the JVM fails, with an OutOfMemoryError.
» Low memory issues
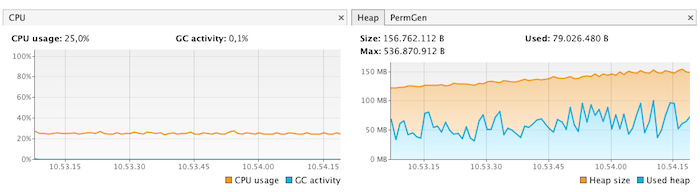
This is an example of an application running with insufficient heap memory:
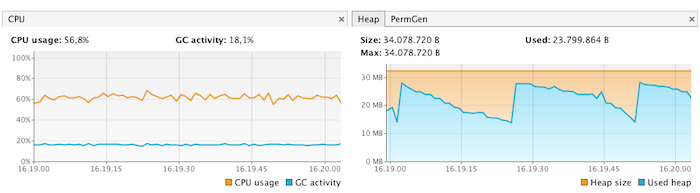
Since garbage collection is a non deterministic process, the memory graph (right side) alone doesn't really tell us if we're running short on heap memory. All we can see is that there have been a number of allocation cycles (blue peaks) and a number of subsequent deallocations (troughs).
We can indeed notice that the Max value of memory available is ~34MB and the peaks are almost touching the 30MB mark, so this is a clue that we might eventually reach the top.
What is really important to notice is the left CPU/GC graph where the blue line shows a constant activity of the GC for quite some time, taking almost 1/3 of the CPU. The longer this activity has been going on, the stronger is the evidence that the memory is being constantly cleaned up to make space for new objects.
In this case increasing the maximum size of the heap from 32MB to 512MB solves the problem, as shown here:
Now the CPU consumption is decreased dramatically, the GC activity is negligible and the overall memory usage has improved.
» Memory leaks
In Java a memory leak occurs when objects in memory are not released even though the application itself no longer needs them. A common example is unused event listeners that aren't removed from their event source.
If the program keeps adding new listener objects but never gets rid of those that are no longer used, we will end up with potentially lots of memory waste. The GC won't be able to regain such memory because the unused listeners are still referenced. If these objects keep piling up we will see a progressive performance degradation which may end up in a JVM crash.
Memory leaks are not always very obvious to find, lurking in the code for quite some time before they are spotted. In other instances the leaks can become very nasty very quickly causing major spikes in the memory usage and ultimately the death of the process.
This is an example of what a nasty memory leak looks like:
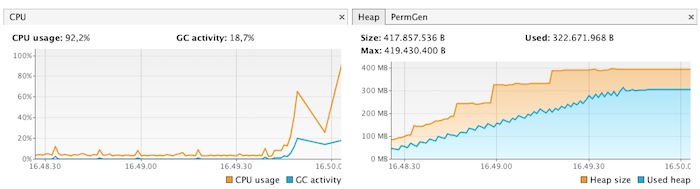
The trend in the memory activity indicates that the GC is unable to recall unused heap space, which in turn is constantly increasing up to the maximum size allowed. Usually this sort of graphs end with a JVM crash, typically due to an OutOfMemoryError. We can see that the CPU spikes are almost hitting the ceiling and the GC is working heavily.
» Identifying the sources of excessive memory usage
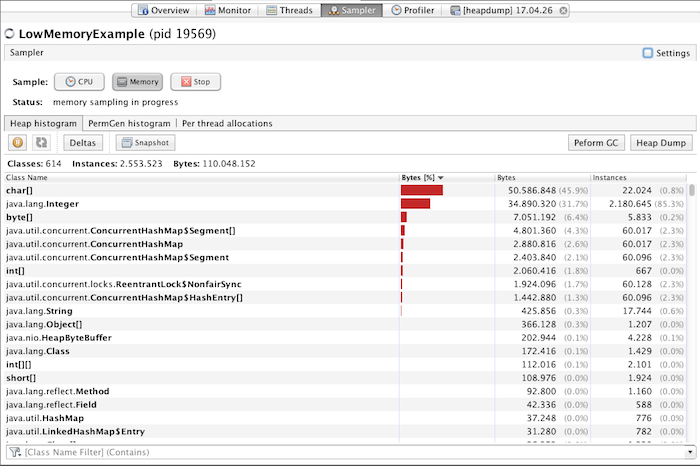
With the Memory Sampler provided by VisualVM we can dig deeper in the JVM heap space and check which classes are actually taking up so much memory. We can start a sampling session by simply clicking on the Sampler tab and the hitting the Memory button.
The live view looks like this:
We can then hit the Heap Dump button to get a snapshot of the memory allocations:
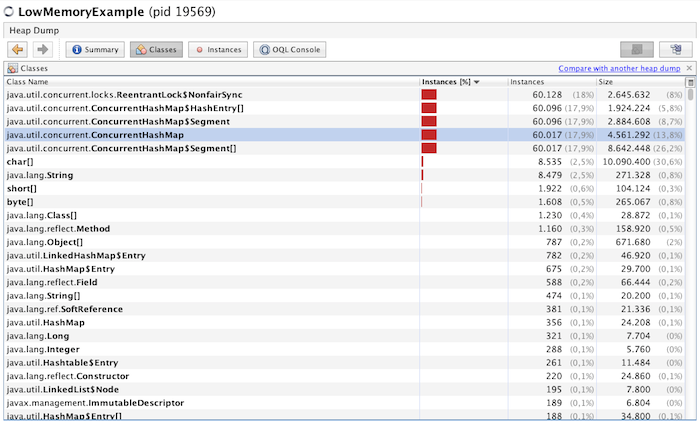
The dump clearly shows that most of the memory intensive objects are instances of the ConcurrentHashMap object. We can then dig deeper in the class to analyze each instance and see their content. Once we have an idea of what the problem is we can go back to our code and investigate the reasons of the leak.
Typically a memory dump will be enough to provide clues about the nature of the problem. In case this isn't sufficient one might need to access a finer level of details using a dedicated Java Profiler.
» PermGen errors
There is also another class of memory errors related to the Permanent Generation (in short PermGen) portion of the JVM memory. PermGen is the area of memory devoted exclusively to class definitions. In other words it's the section of JVM memory where all data from our loaded classes goes.
When working with SmartFoxServer 2X it is possible to saturate the PermGen memory and cause and get a dreaded OutOfMemoryError: PermGen space error.
The cause of this problem is typically due to continuous Extension reloading which in turn create new copies of the Extension classes, possibly exhausting the available PermGen memory.
We provide a detailed description of how class loading works with SmartFoxServer and ways to avoid this problem in this article.
In VisualVM under the Monitor section, we can switch between Heap memory view and PermGen memory view to keep an eye on both memory areas.
In Java 8 and higher PermGen memory has been substituted with so called Meta-Space. Although there are some technical differences in how they work under the hood, they have essentially the same function. You can learn more about it in this external article.
» Analyzing CPU performance
In order to inspect the CPU usage of a live SmartFoxServer you can use several tools:
- The operating system's own resource monitor, which will show you global CPU usage and distribution of load on multiple core processors
- SmartFoxServer's AdminTool which provides more details as to which threads are working harder and state of the internal queues.
- VisualVM Monitor and Sampler to inspect the details of the JVM resource usages.
If the server is not responding very quickly while the CPU resources are mostly free you may suspect that some thread is wasting time waiting for other resources to become available. This is typical of database queries or other blocking calls to external resources (web-services, remote http calls etc...)
In this case taking a look at the Server's queues will probably reveal where the problem is. The example below shows a situation in which the server is struggling to keep up with the current load. Given the relatively low amount of threads used by both controllers the problem is likely to go away by increasing them for both System and Extensions.
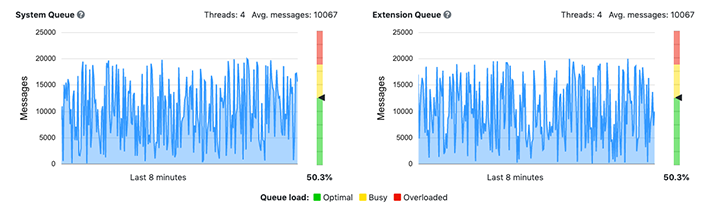
Thread misconfigurations are more likely to happen with SmartFoxServer versions prior to 2.9.0 where the thread pools are configured manually. Since 2.9.0 we have introduced auto-scale thread pools that avoid manual configuration and need minor to no maintenance.
» Identifying the sources of CPU consumptions
By selecting the Sampler view in VisualVM and clicking on the CPU button we can dig deeper in the JVM and discover which classes are working harder and taking up most of the CPU cycles.
For this example we have launched a simple Extension which in turn starts two threads called PrimeRunner and FibonacciRunner which will carry on lots of calculations, generating as many prim numbers and fibonacci values as possible.
By switching to the Thread CPU Time view we can immediately see the impact of this test:
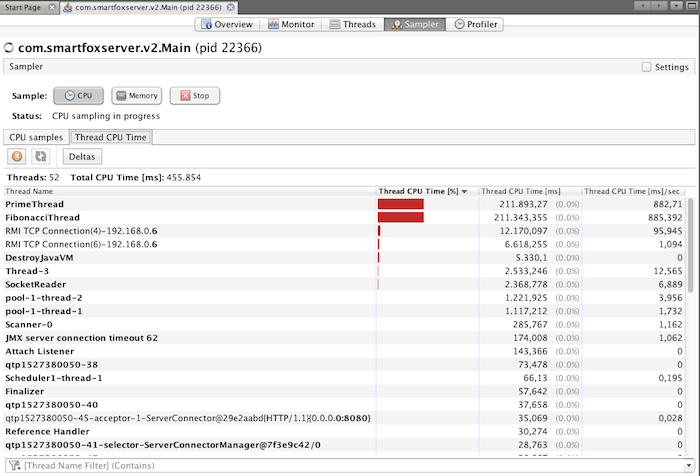
The two hard working threads are on top of the list, clearly showing who is taking most of the CPU cycles. We can also proceed to grab a full thread dump by going back to the CPU samples view and clicking the Thread Dump button. This can be useful to see which method is currently being executed in each thread.
Keep in mind that CPU sampling is not as thorough as profiling the application. A profiler can produce much more detailed performance statistics, but unfortunately it is a much more resource intensive process and cannot be run on a live server.
If you spot a difficult performance issue in your code, you may need to run the VisualVM Profiler (or a 3rd party profiler) in your local test environment to dig deeper into the problem.
» Thread deadlocks
One last problem that could cause the server not to respond is a thread deadlock. This is a dreaded situation that can happen when two or more threads are waiting to finish a competing action and waiting on each other, causing an indefinite block.
Again VisualVM will come to rescue with his Threads view, highlighting deadlocks for us:
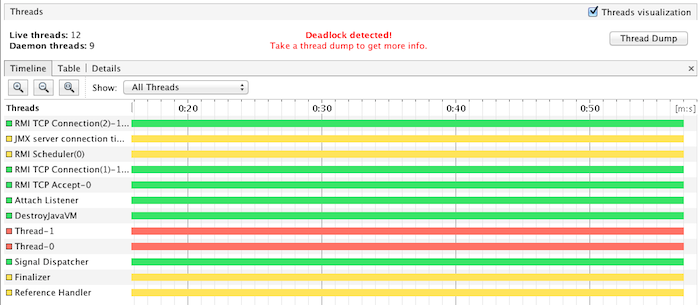
The two threads marked in red seem to be contending the same resource, waiting on each others indefinitely. The next step is obtaining a thread dump by clicking the top left button, and see where exactly in the code those threads got stuck.
» Network issues
Network related issues can be trickier to pin down because they fall outside the monitoring tools we have described here. VisualVM in particular will not help very much in this regard, while the AdminTool can be used to search for clues of excessive network latency or slow downs.
We have a dedicated a specific article to network issues that you can consult here.
» Compiling and sending a support request
Often times we receive questions about performance tuning or resource issues that are lacking the fundamental details that we require in order to help.
Before getting in touch with our support please make sure you gather the following information:
- SmartFoxServer version
- OS type, vendor and version
- Basic summary of the server's hardware (CPU type/cores/speed, RAM, network bandwidth)
- Client platform (Unity, iOS, Android etc...) and version number of the client API
- Synthetic description of the problem
- Specify if the problem is intermittent or it happens all the times. If the latter, provide a step by step description of how to reproduce the problem (if possible)
Additional material:
- A zipped version of the SFS2X/config/ folder
- Inspect the server side logs (SFS2X/logs/smartfox.log) for errors and report any warnings or errors that might be related with the problem in question. If you need to send the log files make sure to zip them.
- If the problem was detected via AdminTool please attach the relevant screenshots with the report.
- If the problem was detected via VisualVM please attach screenshots, thread dumps or resource snapshots to the support request
Support requests can be sent to our support@... email box.