

SFS2X Docs / GettingStarted / admintool-Dashboard
» Dashboard module
The AdminTool's Dashboard module shows the fundamental status indicators that administrators should keep under control when monitoring the SmartFoxServer 2X behavior at runtime.
This tool is divided into three areas monitoring different aspects of SmartFoxServer.
» Global Server Status
The following information is available in the Global Server Status tab.
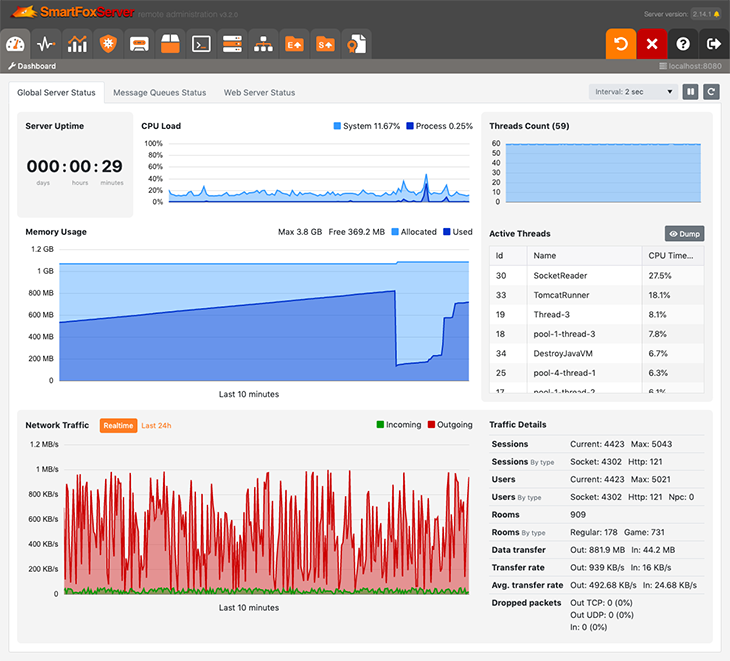
» Server Uptime
The timer shows how long the server has been running since it was started the last time.
» CPU Load
The diagram shows the realtime usage, in percentage, of the available CPU cores. It tells you how busy is the server at the moment: the server starts to get very busy when many concurrent requests are sent and it has to quickly respond to all of them.
» Memory Usage
This diagram shows current memory usage in the Java Virtual Machine.
» Threads Count and Active Threads
The diagram and the data table below it show the number of threads currently running and the CPU time occupied by each of them. This panel can be useful to check if your custom Extension is generating an uncontrolled number of threads causing a degradation in the server performance.
The Dump button generates a thread dump you can easily inspect in any text editor.
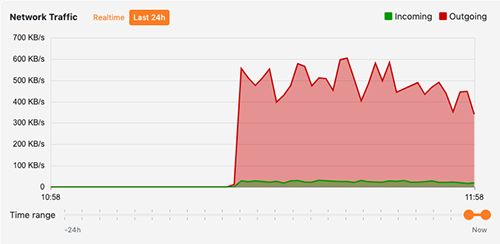
» Network Traffic and Traffic Details
The Network Traffic diagram offers a live view of both the incoming and outgoing data transfer rates of the server. Click on the Last 24h option to switch the traffic diagram from realtime to average values calculated over 5 minutes time spans. This diagram also shows the historical data collected by the server in the previous 24 hours. Use the handles below the chart to change the visualized time frame.
Click on the Realtime option to go back to the realtime diagram.
On the right side of the Network Traffic diagram, the Traffic Details are displayed.
- Sessions: the current number of sessions established by clients, and the maximum number of sessions reached since SmartFoxServer was started.
- Sessions (by type): the current number of sessions divided between socket and http (through the BlueBox service) connections.
- Users: the current number of clients connected to the server which performed a successful login (including Non-Player Characters), and the maximum number of logged users reached since SmartFoxServer was started.
- Users (by type): the current number of logged users divided according to their connection type (socket or http via BlueBox); the number of NPC generated internally by the server-side Extensions is also displayed.
The number of logged-in users is usually lower than the number of sessions, because the latter includes those client which still have to complete the login process. - Rooms: the total number of Rooms currently existing in the system (both regular and game Rooms).
- Rooms (by type): the total number of Rooms currently existing in the system divided according to their type (regular or game Rooms).
- Data transfer: the total amount of outgoing and incoming data transferred between the server and the clients since the server was started.
- Transfer rate: the current per-second data transfer rate, both outgoing and incoming.
- Average transfer rate: the average per-second data transfer rate since the server was started, both outgoing and incoming.
- Dropped packets: the total number of dropped packets since the server was started, both incoming and outgoing (divided per channel type, TCP or UDP). In particular stress conditions or bad network performance the server may drop messages to preserve performance and system memory. For example, when the maximum amount of queued outgoing messages is reached, the server will start dropping. In normal conditions dropped messages are very rare, however if their number becomes consistent it could be the symptom of a lack of bandwidth. Read this troubleshooting document for more information on dropped messages.
» Message Queues Status
The following information is available in the Message Queues Status tab.
The colors of the average value bars give an immediate visual feedback of the queues status. Please note that the average values and the queue load are calculated over the last 240 measurements provided by the server (the same displayed by the charts), as no historical data is available (see note 2 below).
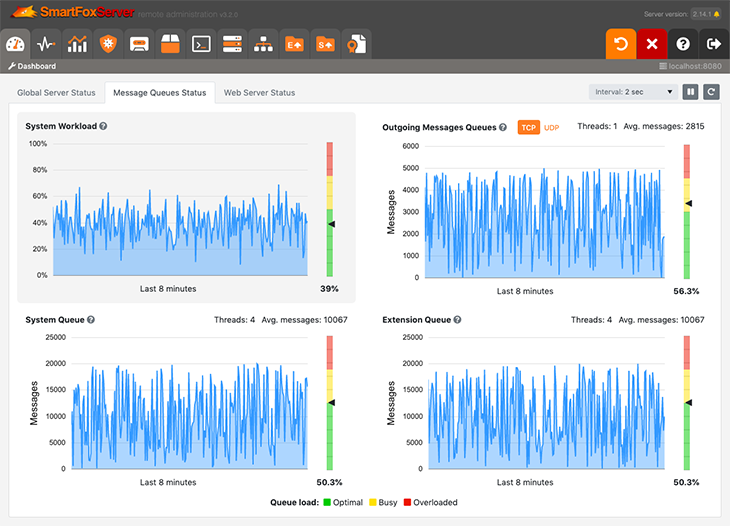
» System Workload
This indicator shows the current and average overall load of the system based on the weighted mean of the other three diagrams converted to a percentage value.
» Outgoing Messages Queue
This diagram shows the current and average size of the system's queue containing the messages to be delivered to the clients, for both TCP and UDP channels. The diagram's header also shows the current number of threads processing the queue.
Please note that the diagram doesn't take the messages sent over websocket channels into account.
» System Queue
This diagram shows the current and average size of the system's queue containing the incoming requests to be processed by the SFS2X System Controller. The diagram's header also shows the current number of threads processing the queue.
» Extension Queue
This diagram shows the current and average size of the system's queue containing the incoming Extension requests to be processed by the SFS2X Extension Controller. The diagram's header also shows the current number of threads processing the queue.
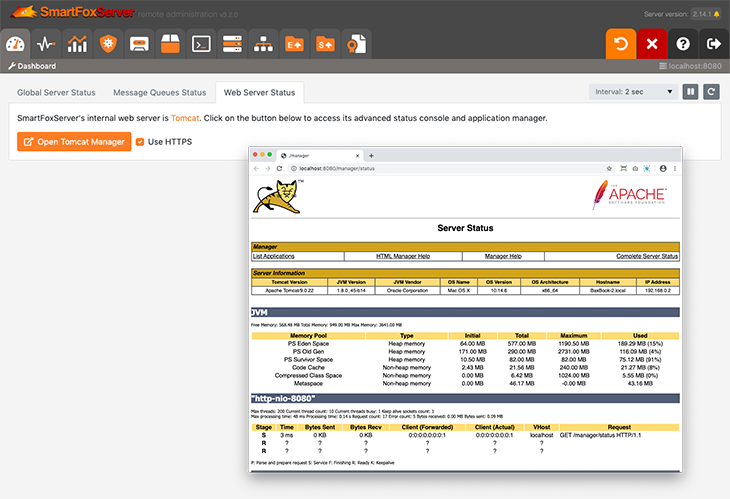
» Web Server Status
SmartFoxServer's internal web server is Apache Tomcat. This tab gives access to Tomcat's native status console and application manager. You should refer to Tomcat's documentation for additional information.
In order to access the Tomcat's manager, dedicated credentials must be set in the Web Server tab of the Server Configurator module.
NOTE 1
Data displayed by this module is not updated in realtime, but a refresh rate can be selected in the Interval dropdown at the top-right corner of the module; two seconds is the default value.
The  button (Pause) allows to stop the diagrams' refresh, to better inspect the data points by hovering them with the mouse pointer.
The  button (Reset realtime charts) clears all the charts, except the 24h Network traffic one. For example this can be useful to start monitoring a load testing session removing all previous data.
NOTE 2
All diagrams, except the 24h Network traffic, do not show historical data: if the module is closed and then loaded again, diagrams are reset.